1. Home Warranty
  2. Blog
  3. Real Estate Professionals
  4. The 2022 American Home Size Index
text reading The 2022 American Home Size Index

The 2022 American Home Size Index

text reading The 2022 American Home Size Index

Over the last 75 years, the U.S. housing market has undergone a dramatic transformation. Rising productivity, high demand for housing, and new highways built in the wake of World War II pushed many Americans to the suburbs, where homeownership rose and density decreased. The average number of occupants in each home fell, while the average size of a new single-family home ballooned - from just 909 square feet in 1949 to 2,480 square feet in 2021. In 1950, 15.7% of U.S. homes were overcrowded; by 2000 that number had fallen to 5.7%.

The shift towards larger homes was exacerbated by the COVID-19 pandemic when concerns over social distancing and remote work led many to relocate from urban areas to suburban and rural neighborhoods. In one September 2019 survey, 53% of respondents said they preferred to live in a community where the houses are larger and farther apart, with schools, stores, and restaurants several miles away. By July 2021 that figure had risen to 60%.

Home sizes and prices vary from state to state and city to city, dictated by changes in supply, demand, and other factors. But where in America are the biggest homes? And where are they the most expensive? Home warranty company American Home Shield has created the 2022 American Home Size Index to find out.

What We Did

To determine the average home size in every state, American Home Shield reviewed 506,374 listings of houses and condos for sale from Zillow. We dropped the listings without home size, price, or city and removed the ones with home size set to ‘0.’ After processing, our dataset was left with 474,157 houses. We categorized houses and condos built in 2018 or later as new homes (142,659 listings).

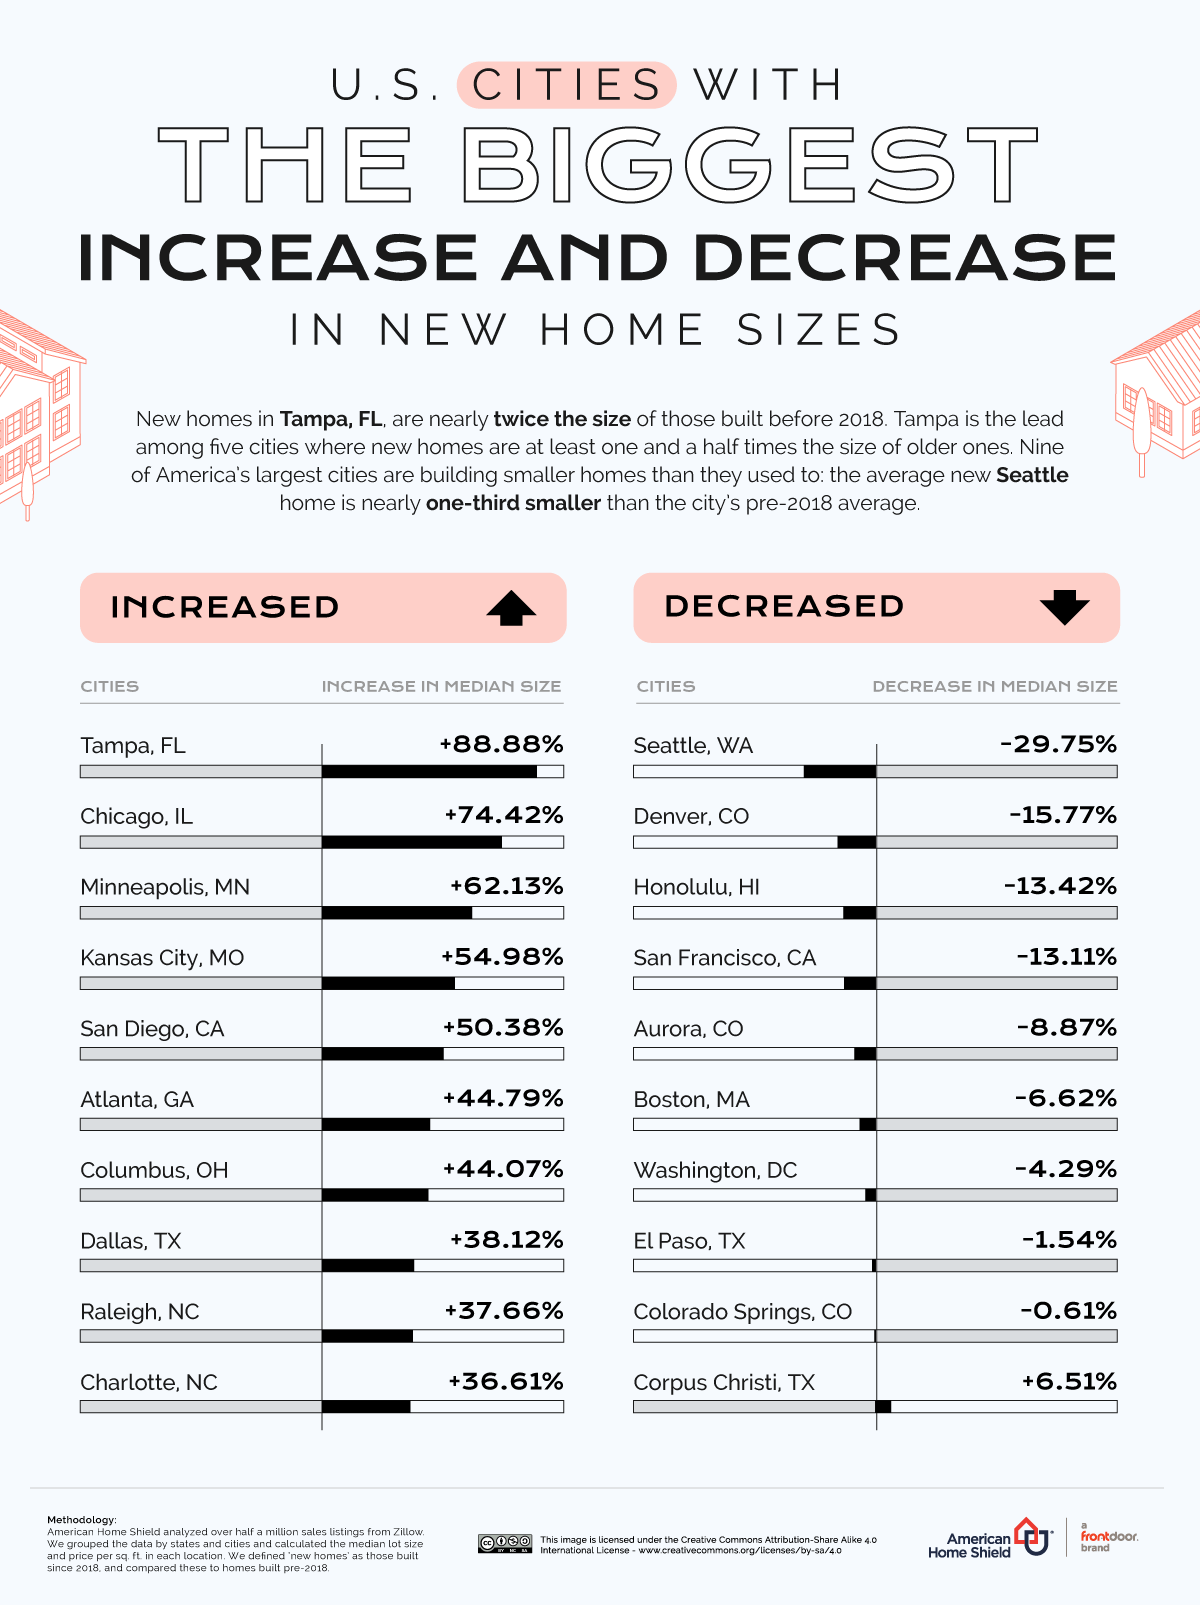
Next, we grouped the data by states and cities and calculated the median lot size and the median price per sq. ft. across each group. We also computed the increase in median home size by comparing new homes (post-2018) and older homes (pre-2018). We kept only cities with at least 300 listings and 20 new listings.

Key Findings

  • Fast-growing tech hubs in the Rocky Mountains have the largest homes. In Colorado Springs, the average home is 2,760 square feet – the largest of any major U.S. city.
  • Areas with newer housing stock have larger homes. In Utah, the state with the largest homes, the typical home is 33 years old – 11 years newer than the U.S. median.
  • High-density coastal cities have the most expensive real estate. In New York City, there are 28,182 people per square mile, and homes cost $1,519.57 per square foot on average – each the highest such figure of any major U.S. city.
  • Expensive real estate may be driving people to look for cheaper homes elsewhere. From 2020 to 2021, the population of New York City fell 3.5% – the second largest decline of any major U.S. city.

Comparing Home Sizes Across the Country

Several factors can dictate how large the average home is in a certain state or city. One of the primary factors is the age of the housing stock. American homes have gotten larger over time; states with a higher percentage of new homes tend to have larger homes on average. The typical home in Utah, for example, was built in 1989, the third youngest median year built for homes in any state. The average home in Utah is 2,800 square feet, the most of any state.

At the city level, home age can also be a good predictor of size. In Raleigh, NC, for example, the typical home was built in 1993, the second youngest median year built for homes in any major city. The average home in Raleigh is 2,366 square feet, the third largest of any city. Similarly, the typical home in Henderson, NV, was built in 1998 – the youngest housing stock of any city. The average home in Henderson is 2,337 square feet, the fourth largest of any city.

Wondering how your city compares? View the interactive comparison tool below to quickly see how home sizes vary from state to state and city to city.

Rural, Western States Have the Largest Homes

Potential homebuyers looking to purchase a large home should look westward. The four states with the largest average homes – Utah, Colorado, Idaho, and Wyoming – are all in the West and are largely rural. The average home in Utah, for example, is 2,800 square feet – more than double the 1,164-square foot average in Hawaii, the state with the smallest homes.

Average House Size by States

As the preference for large home sizes and low-density neighborhoods increases, many Americans are moving to states with larger houses. The population of Idaho, for example – where homes are 2,311 square feet on average, the third largest of any state – rose 2.9% from 2020 to 2021 – the largest increase in the United States. The population of Utah increased 1.7% from 2020 to 2021, the second largest increase. 

Thinking about coverage?

Sounds like a plan. Find the warranty that fits you best.

Fast-Growing, Midsize Tech Hubs Have the Largest Homes

While major coastal cities like San Francisco, San Jose, Los Angeles, New York City, and Washington, D.C. were once the main drivers of job growth, in recent years employment growth has shifted to smaller, suburban cities with more affordable housing and lower costs of living. The development of tech hubs in fast-growing, well-educated areas like Colorado Springs, CO; Fort Worth, TX; and Raleigh, NC, has allowed wealth to flourish in midsize cities and created a demand for newer, larger homes.

Average House Size Cities

A U.S. Bureau of Labor Statistics data search shows that while nationwide employment growth fell 0.3% from 2017 to 2021, in Aurora, CO, the number of jobs grew 5.7% – the sixth largest job growth of any city with at least 150,000 workers. The influx of new workers has created the demand for new housing, pushing up the size of the average Aurora home. Today, the average home in Aurora is 2,451 square feet, the second largest of any U.S. city. The typical home in Aurora is 38 years old – six years newer than the U.S. median.

About 70 miles south of Aurora down I-25 is Colorado Springs, also a fast-growing tech hub with growing demand for large new homes. From 2017 to 2021, employment in Colorado Springs grew 5.3%, the seventh largest increase of any city with at least 150,000 workers. New, high-income workers create demand for large, new homes, and in Colorado Springs, the average home is now 2,760 square feet – the largest of any U.S. city.

States With the Most Expensive Real Estate Have Smaller Homes

One factor that dictates home size is the cost of real estate. Many of the states with the smallest average home sizes in the West and Northeast also have the most expensive real estate per square foot, limiting the supply of large, suburban homes found throughout the Rocky Mountains or Mid-Atlantic states.

In Hawaii, the average home costs a whopping $743.86 per square foot – the most of any U.S. state and more than six times the cost of real estate in West Virginia. The average home in Hawaii is just 1,164 square feet, the smallest of any state. Similarly, in New York, the average home costs $421.49 – the third most of any state. The average home size in New York is 1,490 square feet – the second smallest of any state.
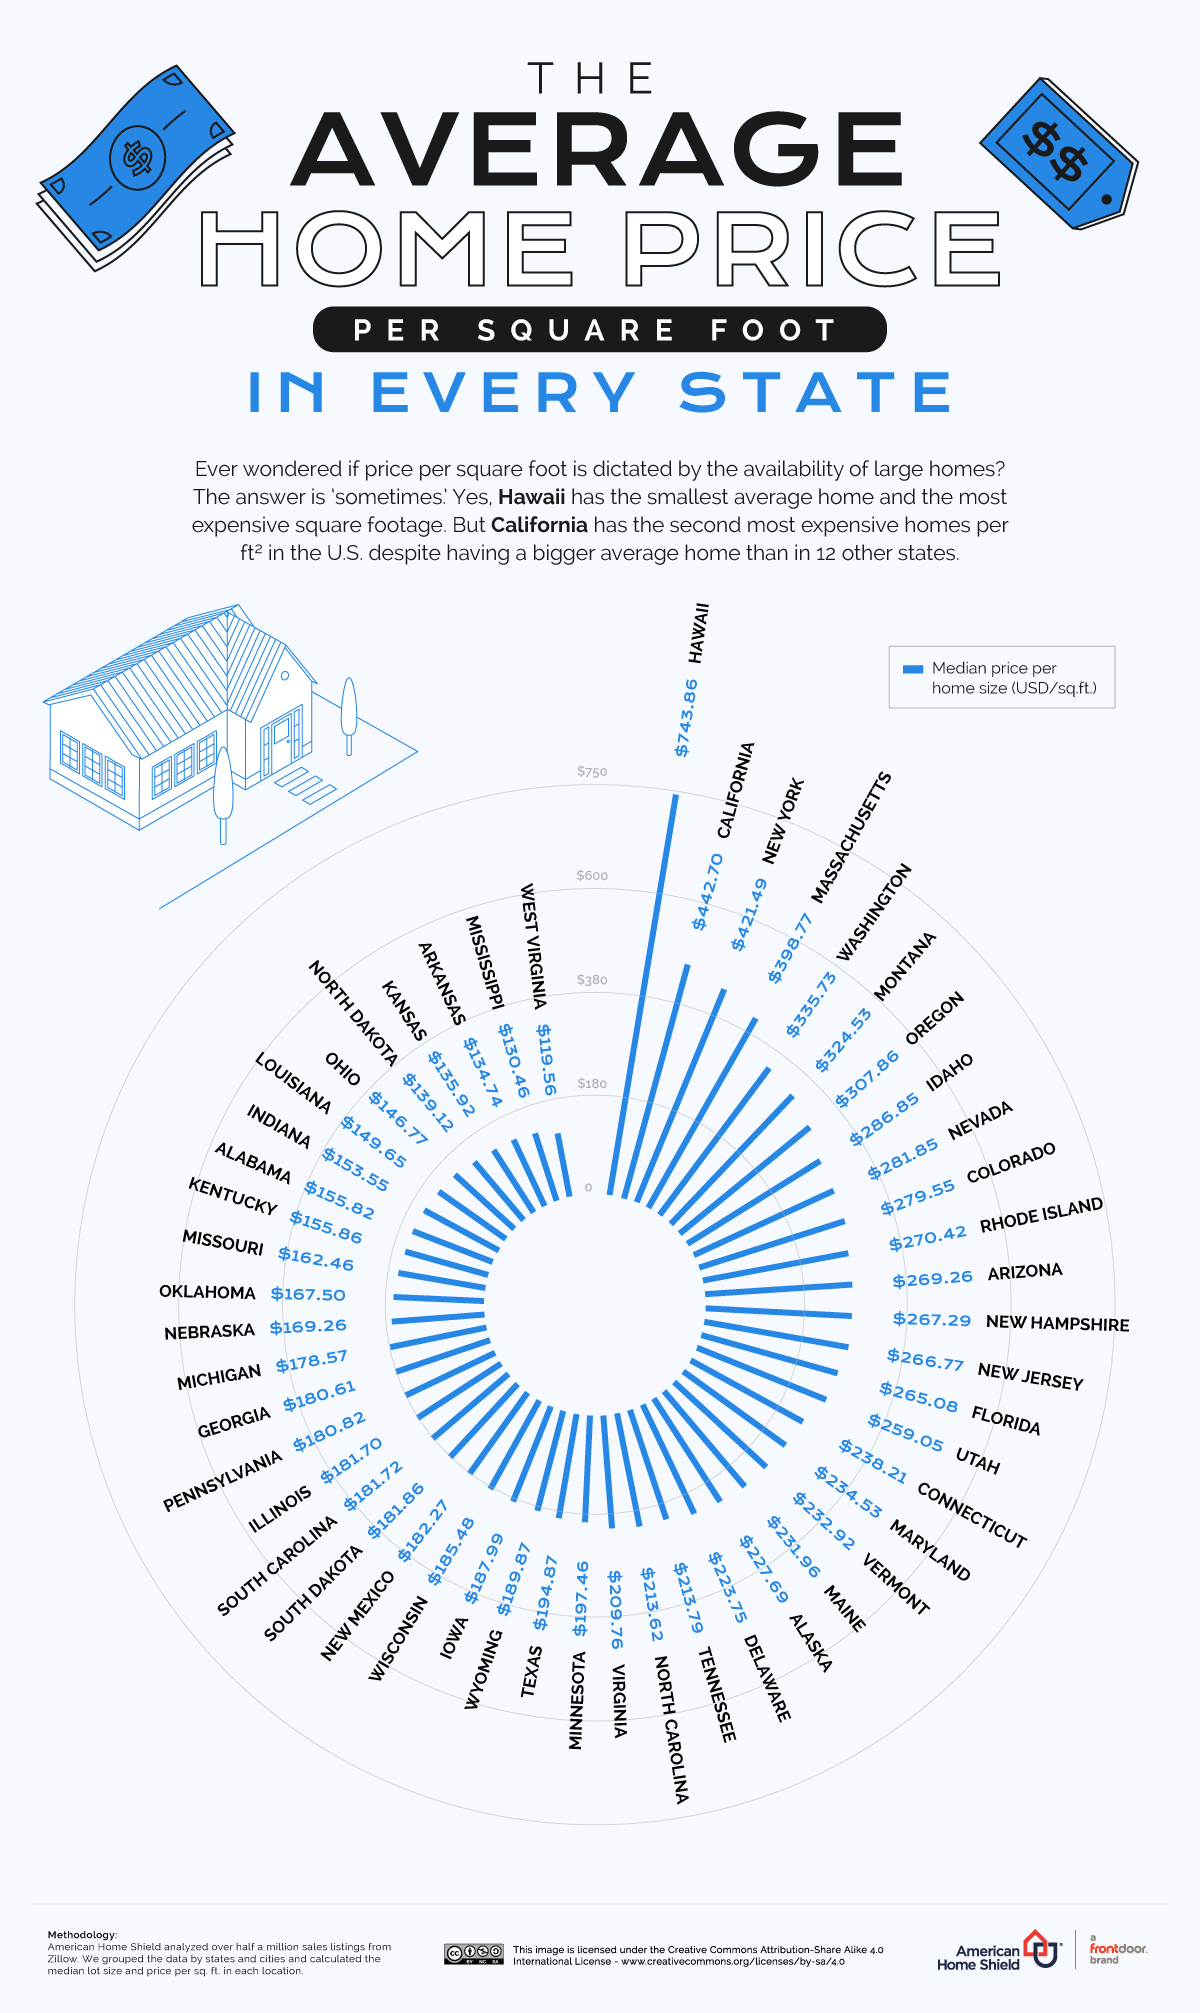
Average House Price on every State

But high costs of small homes in the West and Northeast may also be pushing people to look for cheaper, large homes in other parts of the country. From 2020 to 2021, the population of Hawaii declined by 0.7%, the third largest decline of any state. The population of New York declined by 1.6% over the same period, the largest decrease of any state.

Dense, Coastal Cities Have the Most Expensive Homes

Dense, coastal cities with limited, older housing stock have the most expensive homes. In New York City, there are 28,182 people per square mile – by far the densest major city in the United States. The average home in New York City costs $1,519.57 per square foot, more than 20 times the cost of housing in Cleveland or Detroit and the most of any city.

Similarly, in San Francisco, there are 17,376 people per square mile – the second densest population of any major U.S. city. In a dense city with natural growth boundaries like San Francisco, high density coupled with demand can drive the price of housing sky high. The average home in San Francisco costs $1,074.34 per square foot, the third most expensive real estate of any city in the country.
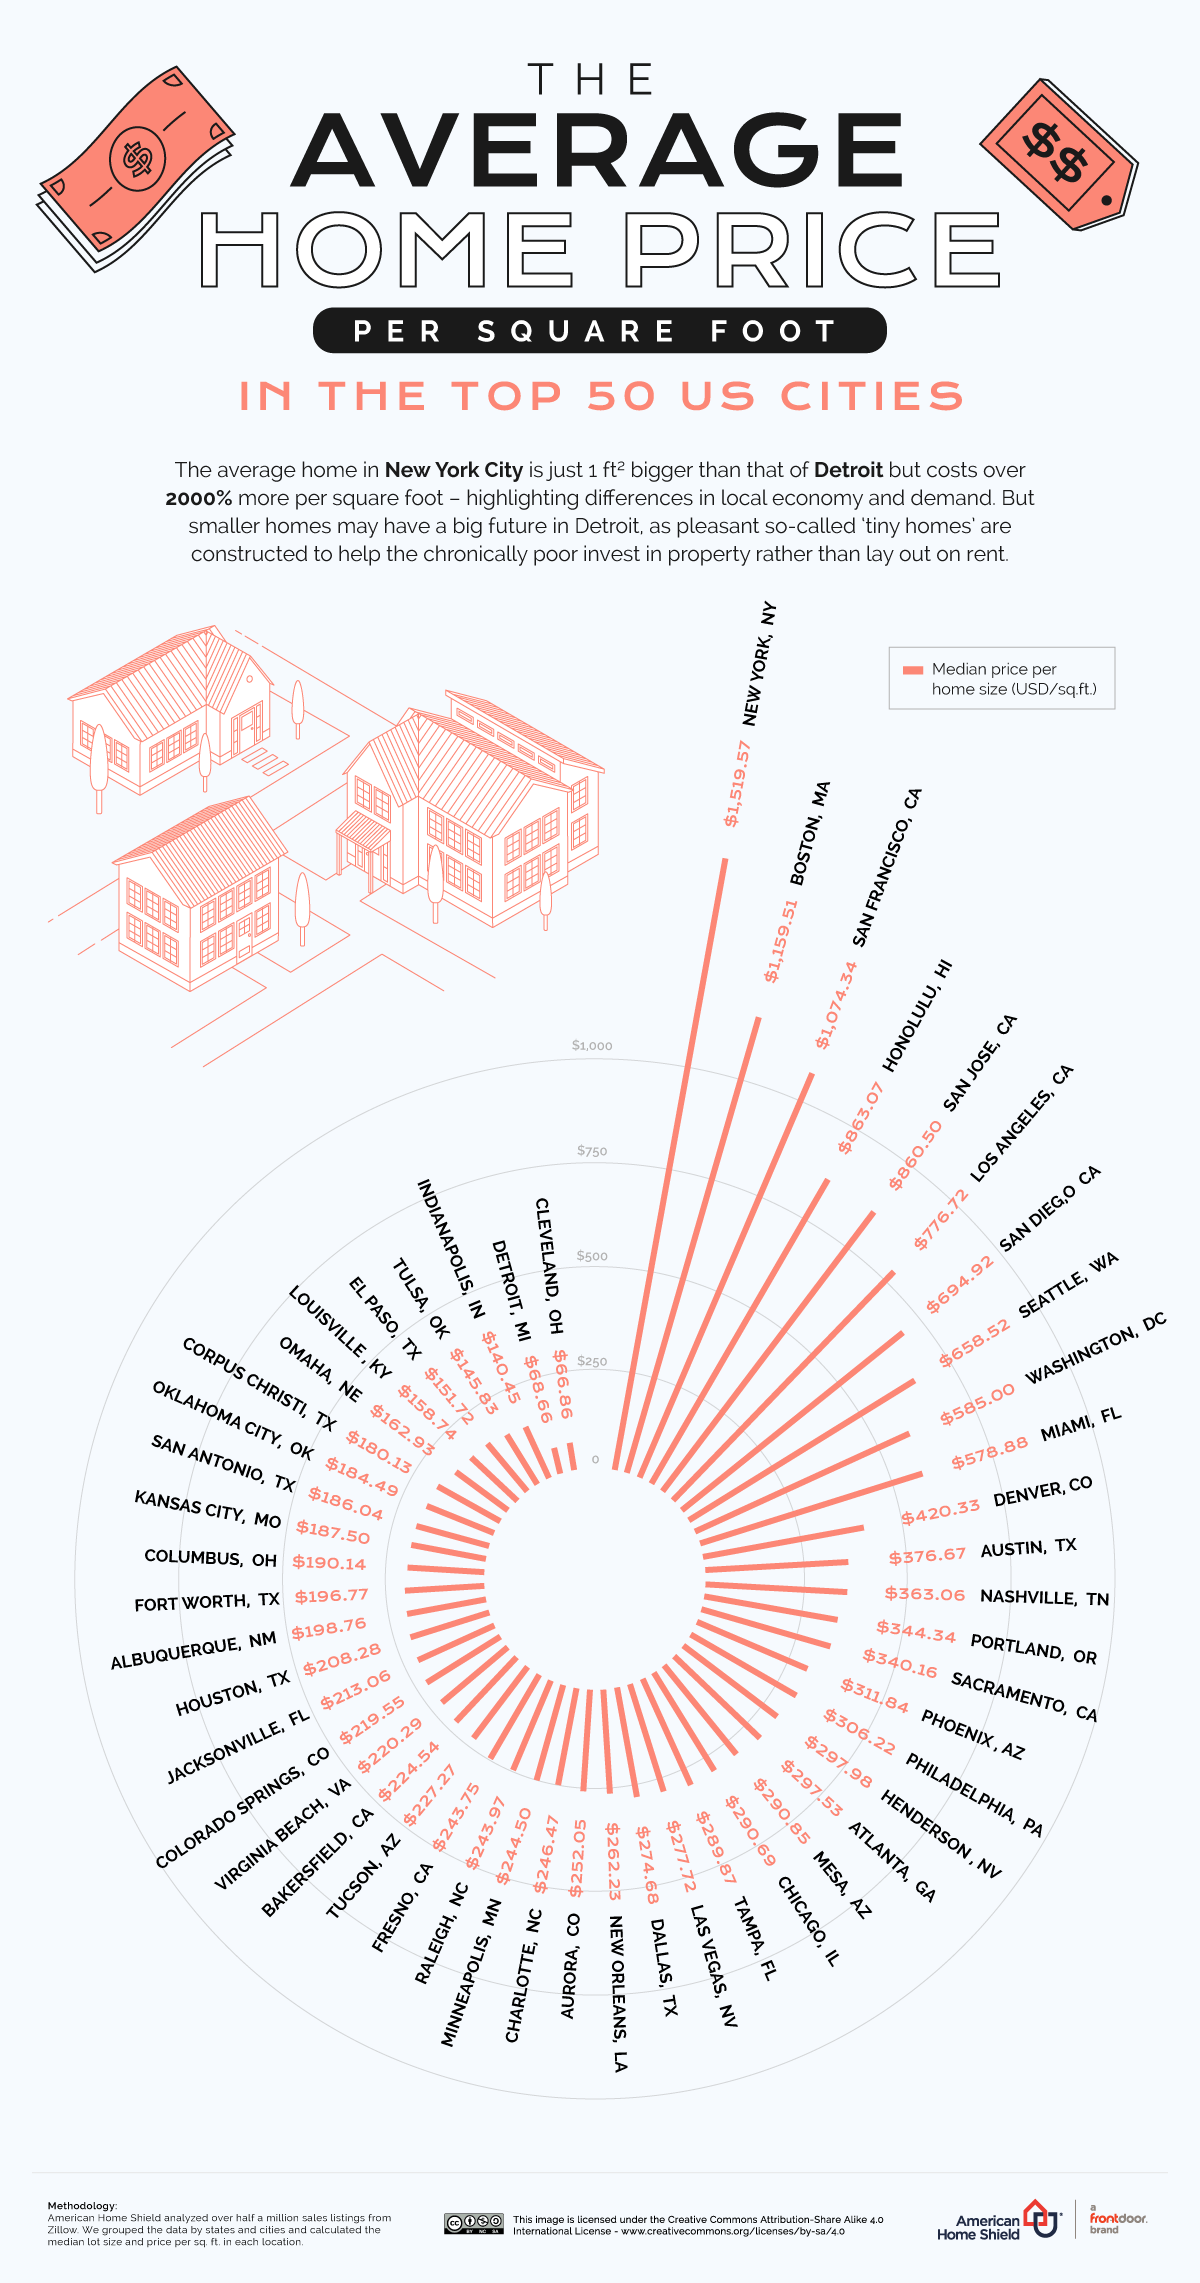
Average House Price by Cities

In recent years, however, skyrocketing real estate prices have driven many Americans from major coastal cities to more affordable suburban ones. From 2020 to 2021, the population of New York City declined by 3.5%, the second largest decline of the top 50 largest cities. The population of San Francisco fell 6.3%, by far the largest decline.

Homeowners In Older States May Be Downsizing Their Homes

Home sizes are often dedicated by demographics and can change in tandem with the size and composition of an area’s population. In some parts of the country, one factor that may dictate changing home sizes is the age of a population. As homeowners age, they often downsize their homes, leaving large, family homes for smaller dwellings. According to data from Zillow, 46% of baby boomers who moved in 2021 were downsizing to a smaller home.
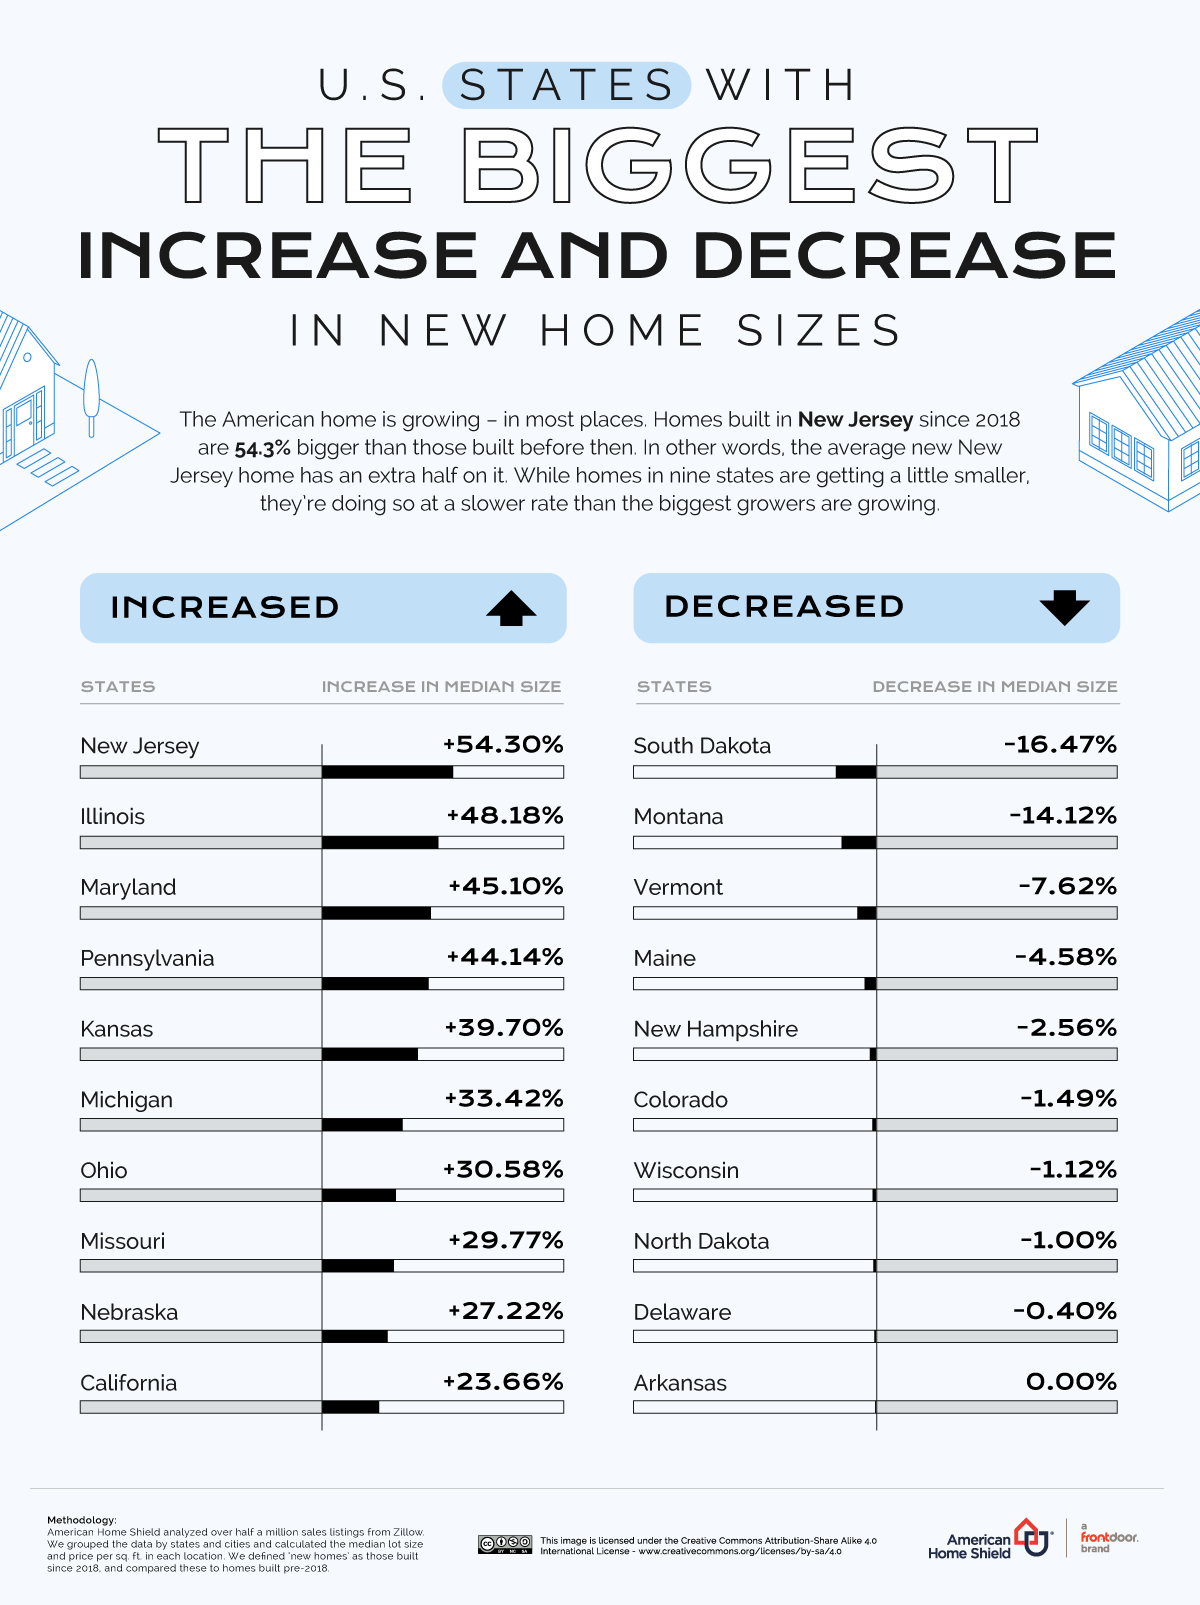
New Houses by States

In Vermont, the percentage of the population that is 65 and older grew from 16.3% in 2015 to 19.4% in 2020 – the largest increase of any state. The housing market likely responded to the increased demand for smaller homes from older residents, as homes in Vermont are now 7.6% smaller than they were prior to 2018 – the third largest decline of any state. Similarly, in Maine, the 65-and-older cohort grew from 17.6% of the population in 2015 to 20.6% in 2020, the second largest increase of any state. Homes in Maine are now 4.6% smaller than they were prior to 2018, the fourth largest decline of any state.

Trends In Home Size Vary By City

The supply and demand for new housing can dictate home sizes. In some cities with high demand for housing, developers continue to build large, new homes, raising the average home size. The population of Tampa, FL, for example, grew 0.8% from 2020 to 2021 – the sixth largest increase of any of the 50 largest U.S. cities. In response to the increased demand and the large supply of vacant land, developers built bigger homes. The average home in Tampa is now 88.9% larger than it was prior to 2018, the largest increase of any city.

Other fast-growing cities, however, went the other direction – building smaller homes to accommodate the large influx in demand. The population of Aurora, CO, for example, grew 0.7% from 2020 to 2021, the ninth largest increase of any major U.S. city. The average home in Aurora is 8.9% smaller now than it was prior to 2018, the fifth largest decline of any large city in the United States.
New Houses by Cities

In some cities, larger homes may be the result of growing family sizes. In Minneapolis, where home sizes have grown the third fastest since 2018, the average family size grew 1.3% from 2015 to 2020 – one of the largest increases in any city. In Charlotte, where homes have grown the 10th fastest since 2018, the average family size grew 2.2% from 2015 to 2020 – also one of the largest increases of any city.

Home Sizes Across the Country

Knowing the average size and price per square foot of homes throughout the United States can help potential homebuyers find the perfect place for them. Homebuyers looking for compact, older homes may do best to look in major coastal cities like New York City, Boston, or San Francisco, while those looking to get a little more home for their buck may want to join the thousands of Americans moving to fast-growing, midsize tech hubs in the Rocky Mountains and Mid-Atlantic.


In some cities, the high cost of real estate per square foot coupled with small home sizes can lead to relatively low home prices overall. In Philadelphia, for example, the average home costs $306.22 per square foot – among the most of any major city. With an average home size of 1,318 square feet, however, the average home in Philadelphia costs $403,598 – among the least of any U.S. city.

Conversely, in Colorado Springs the average home costs $213.79 per square foot, among the least of any major city. At an average size of 2,760 square feet, however, homes in Colorado Springs cost $605,958 on average – among the most of any city.

Staying Informed In a Volatile Housing Market

While “location, location, location” was once the guiding mantra in real estate, in recent years the rise in remote work has led many to move from expensive city centers to more affordable suburban areas. Americans want larger homes in lower-density areas since the COVID-19 pandemic, and developers are quick to accommodate their demand. Construction on new homes is booming, and real estate values continue to soar. But every housing market is different, and while homes in some cities are getting larger, homes in other areas are downsizing. Before starting your next real estate search, it is important to know which cities and states have the largest homes.


Methodology

To create these tables, we pulled 506,374 listings of houses and condos for sale from Zillow. We dropped the listings without home size, price, or city and removed the ones with home size set to ‘0.’ Although using median figures should minimize outliers and inadequate values, we pre-cleaned such values using the DBSCAN clustering algorithm (467 listings were removed). After processing, our dataset was left with 474,157 houses. We categorized houses and condos built in 2018 or later as new homes (142,659 listings).

Next, we grouped the data by states and cities and calculated the median lot size and the median price per sq. ft. across each group. We also computed the increase in median home size by comparing new homes (post-2018) and older homes (pre-2018). 

We kept only cities with at least 300 listings and 20 new listings.

The data was collected in May 2022.

Share:

Was this article helpful?

AHS assumes no responsibility, and specifically disclaims all liability, for your use of any and all information contained herein.

American home shield short logo mark

Don't Worry. Be Warranty.

Have a plan for your home when things don't go according to plan

Shop Home Warranties

Staging